

QuadraScan captures a full set of anthropometric and body-composition measurements instantly. Below is a sample of how that data gets put to work across different verticals.
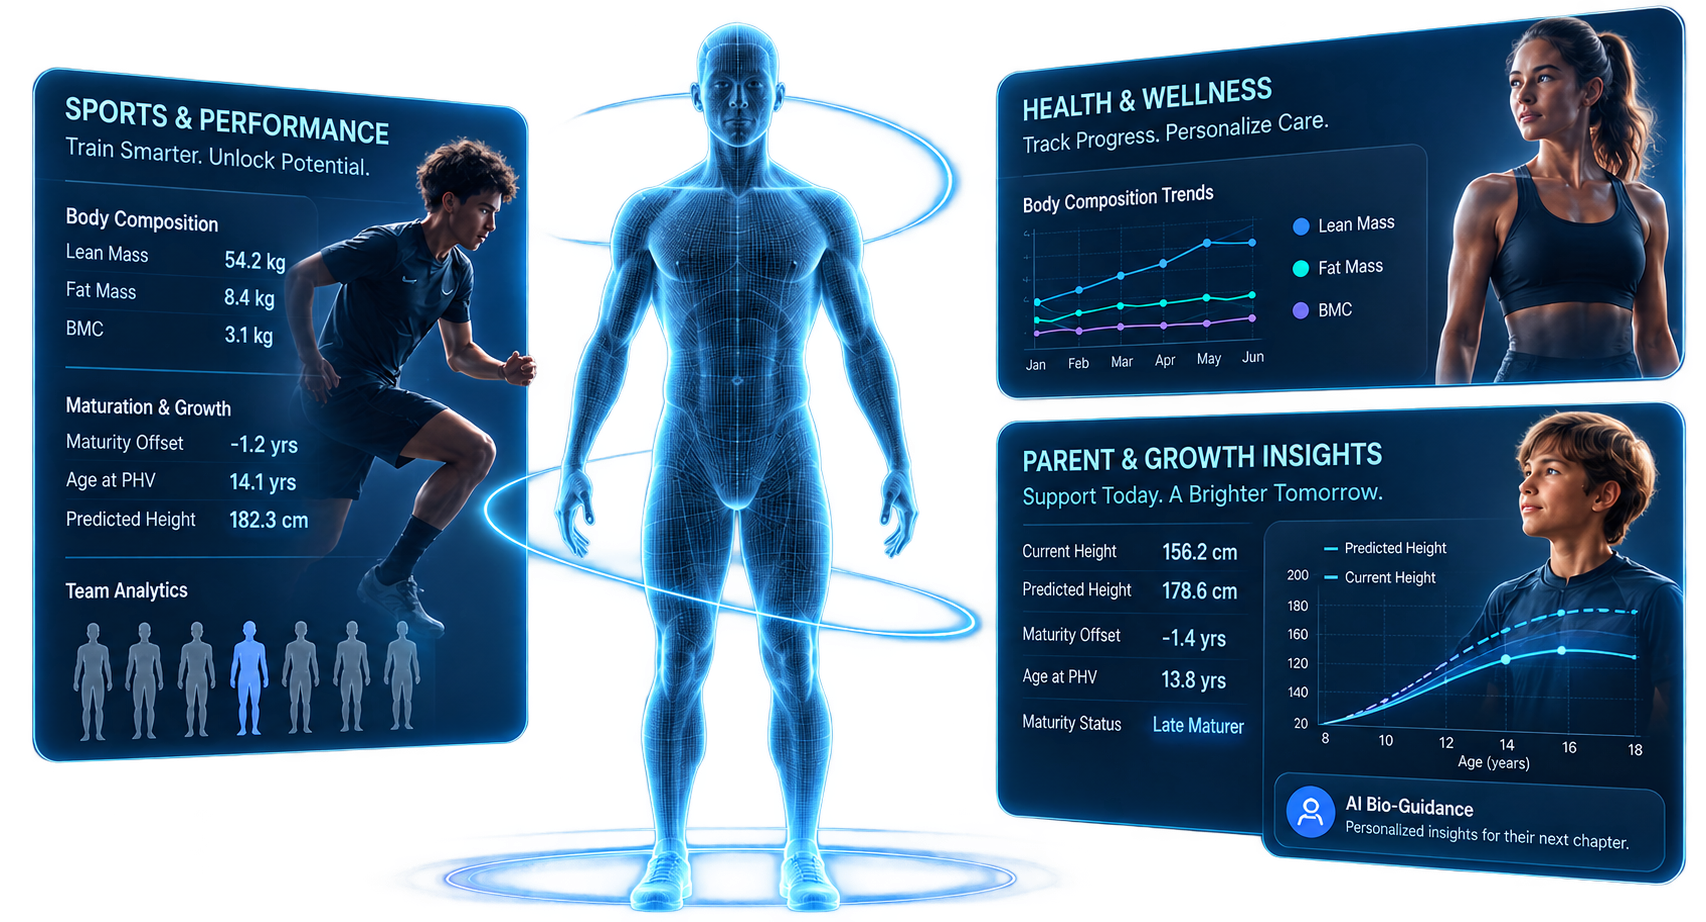
Growth and maturation can dramatically influence how young athletes look and perform today. QuadraScan gives organizations the body intelligence to understand where an athlete is now, and where they’re heading.
Track maturation, PHV, predicted height, body composition and longitudinal development at the individual level. Then benchmark across teams, age groups and cohorts to put performance in biological context.
Late-developing athletes who may otherwise be overlooked.
Understand athletes relative to teammates and comparable cohorts.
See how bodies change across a season—not just on assessment day.
Jordan's estimated PHV age (14.4) sits slightly behind the median for his age group. Some of the physical gap versus early-maturing peers is timing, not talent. The kind of signal that keeps late bloomers from getting cut too early.
Benchmark athletes by age, cohort, team or population to understand distributions, identify outliers and establish more meaningful developmental context.
Line marker = median PHV age · shaded band = interquartile range (P25–P75) · scale 13.0–15.0 yr
Sample athlete, name changed and figures lightly adjusted. Benchmarking data from a 386-scan soccer demo dataset.
Turn every scan into an easy-to-understand view of a child’s growth and development with measurements, body composition, maturation and growth insights brought together in one personalized experience.
Height, measurements and body composition.
Maturity status, PHV and cohort comparisons.
Growth modeling and predicted adult height.
Repeat scans create a longitudinal view of development over time.
BMI shown reflects percentile-for-age, not adult weight categories.
This athlete is estimated to reach peak growth in about 3.2 years. Training can continue building a broad athletic base, with strength/skill work phased in as he approaches peak growth.
A scale shows one number. QuadraScan shows what is changing underneath it.
Track fat mass, lean mass, body measurements and longitudinal change throughout a weight-management journey. We give patients, providers and organizations a richer view of progress than weight or BMI alone.
Sample patient journey for illustration. Individual results vary.